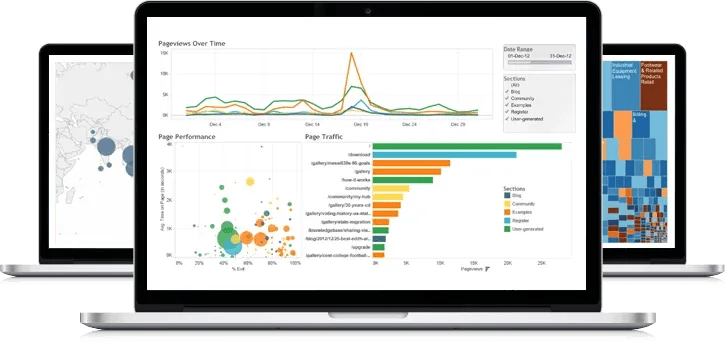
Features of Tableau:
Tableau Dashboard
Tableau Dashboards provide a wholesome view of your data by the means of visualizations, visual objects, text, etc. Dashboards are very informative as they can present data in the form of stories, enable the addition of multiple views and objects, provide a variety of layouts and formats, enable the users to deploy suitable filters. You even have the option to copy a dashboard or its specific elements from one workbook to another easily.
Collaboration and Sharing
Tableau provides convenient options to collaborate with other users and instantly share data in the form of visualizations, sheets, dashboards, etc. in real-time. It allows you to securely share data from various data sources such as on-premise, on-cloud, hybrid, etc. Instant and easy collaboration and data sharing help in getting quick reviews or feedback on the data leading to a better overall analysis of it.
Live and In-memory Data
Tableau ensures connectivity to both live data sources or data extraction from external data sources as in-memory data. This gives the user the flexibility to use data from more than one type of data source without any restrictions. You can use data directly from the data source by establishing live data connections or keep that data in-memory by extracting data from a data source as per their requirement. Tableau provides additional features to support data connectivity such as automatic extract refreshes, notifying the user upon a live connection fail, etc.
Data Sources in Tableau
Tableau offers a myriad of data source options you can connect to and fetch data from. Data sources ranging from on-premise files, spreadsheets, relational databases, non-relational databases, data warehouses, big data, to on-cloud data are all available on Tableau. One can easily establish a secure connection to any of the data sources from Tableau and use that data along with data from other sources to create a combinatorial view of data in the form of visualizations. Tableau also supports different kinds of data connectors such as Presto, MemSQL, Google Analytics, Google Sheets, Cloudera, Hadoop, Amazon Athena, Salesforce, SQL Server, Dropbox and many more.
Advanced Visualizations (Chart Types)
One of the key features of Tableau and the one that got its popularity is its wide range of visualizations. In Tableau, you can make visualizations as basic as a:
Maps
Yet another important feature of Tableau is the map. Tableau has a lot of pre-installed information on maps such as cities, postal codes, administrative boundaries, etc. This makes the maps created on Tableau very detailed and informative. You can add different layers of geology on the map as per your requirements and create informative maps in Tableau with your data. The different kinds of maps available in Tableau are Heat map, Flow map, Choropleth maps, Point distribution map, etc.
Robust Security
Tableau takes special care of data and user security. It has a fool-proof security system based on authentication and permission systems for data connections and user access. Tableau also gives you the freedom to integrate with other security protocols such as Active Directory, Kerberos, etc. An important point to note here is that Tableau practices row-level filtering which helps in keeping the data secure.


